This had the advantage of familiarity, but we're leaving some powerful tools on the table. Turning Excel into a logic analyzer display may be a cute trick, but it comes with a few limitations. Zooming out and scrolling is a bit awkward and slow, and of course, there's that 1M row limit staring us in the face.
Ultimately, our goal is to eventually compare execution results between our logic analyzer and our emulator. How are we going to accomplish that? A simple CSV diff goes off the rails the moment an interrupt occurs at a different time, even though that timing difference may or may not represent an accuracy problem. Diffing cycle logs is no trivial task.
In contrast, a competent logic analyzer program scrolls through massive numbers of samples and zooms in and out with ease. What's more, we can add annotations at any point, which may help us call out landmarks within code execution, such as "effect ISR begins here", or something similar. I even have a sneaky plan for using it as a fancy diff tool - but more on that later.
I understand from certain sources that the sigrok project may be in a bit of development limbo, but I don't think it's quite dead yet. I hope that the project continues - it's already very powerful, as we will soon see.
A signal decoder in PulseView is a Python plug-in that analyzes the signals in a specific file, along with any inputs to the plug-in configuration interface, and produces annotations - colored bars with labels that may appear on their own rows as if they were new signals.
First, you configure your desired bus lines and select the clock signal in the configuration box:
The decoder then is run on all the data samples in the capture and produces annotations (depending on the size of your capture and the decoder involved, this may take a while!)
Here we can see that for each clock, the AD0-AD7 lines have been decoded into a single hexadecimal byte and displayed. Annotations aren't limited to specific widths of inputs, the decoder provides the starting and ending sample for each annotation.
This basic principle turns out to be quite flexible - since the decoders are just Python programs, they can keep arbitrarily complex state. Which is good - since the 8088's multiplexed bus would make naïve decoding impossible. We can't just decode the address off the bus on every cycle since the address is only valid on ALE, and likewise, we can't decode the data bus until the precise time where the READY line is asserted and we're in T3 or Tw. Speaking of ALE, we don't even have that signal, so we have to detect it when the S0-S2 status lines transition from a passive to active status. If we want to eventually add a disassembly annotation, we'll need to track a virtual processor instruction queue as well, inserting bytes when they are fetched during CODE bus cycles and extracting them when the queue is read.
The gist is that a decoder is an instance of a Decoder class. There are some common values defined in this class for every decoder, things like name, desc, inputs, options, annotations, etc. - see the basic example of a Decoder class at the link above.
sigrok refers to the individual sample lines as 'pins', so we'll adopt that terminology too.
If something goes wrong in our decoder, such as our Python code encounters a syntax error or exception, we'll see this on our annotation line:
Here we can more easily track down what went wrong.
Debugging in sigrok-cli is another possibility. We can create a task in our IDE to copy our decoder into the decoders directory of both PulseView and sigrok-cli at the same time. Once you've written a sigrok decoder, they'll work in either program.
If there's a syntax error in our Decoder class, it won't even show up as an available decoder. We can issue the command sigrok-cli -L which will attempt to load all decoders and present them as a list - any errors encountered in this process will be displayed, just scroll up past the list to view them. If we see our decoder in the list, however, there's an issue somewhere during the decode() execution. To catch that, we can run our decoder with the -i option to sigrok-cli, providing a suitable input file and the name of our decoder, like so:
Writing our 8088 Decoder
The first step of our decoder is to specify the metadata that describes our decoder and its required inputs.
class Decoder(srd.Decoder):
    api_version = 3
    id = 'i8088'
    name = 'i8088'
    longname = 'Intel 8088 CPU'
    desc = 'Decoder for the Intel 8088 CPU'
    license = 'gplv2+'
    inputs = ['logic']
    outputs  = []
    tags = ['Retrocomputing']
    channels = (
        {'id': 'ad0', 'name': 'AD0', 'desc': 'Address/Data Line 0'},
        {'id': 'ad1', 'name': 'AD1', 'desc': 'Address/Data Line 1'},
        {'id': 'ad2', 'name': 'AD2', 'desc': 'Address/Data Line 2'},
        {'id': 'ad3', 'name': 'AD3', 'desc': 'Address/Data Line 3'},
        {'id': 'ad4', 'name': 'AD4', 'desc': 'Address/Data Line 4'},
        {'id': 'ad5', 'name': 'AD5', 'desc': 'Address/Data Line 5'},
        {'id': 'ad6', 'name': 'AD6', 'desc': 'Address/Data Line 6'},
        {'id': 'ad7', 'name': 'AD7', 'desc': 'Address/Data Line 7'},
        {'id': 'a8',  'name': 'A8',  'desc': 'Address Line 8'},
        {'id': 'a9',  'name': 'A9',  'desc': 'Address Line 9'},
        {'id': 'a10', 'name': 'A10', 'desc': 'Address Line 10'},
        {'id': 'a11', 'name': 'A11', 'desc': 'Address Line 11'},
        {'id': 'a12', 'name': 'A12', 'desc': 'Address Line 12'},
        {'id': 'a13', 'name': 'A13', 'desc': 'Address Line 13'},
        {'id': 'a14', 'name': 'A14', 'desc': 'Address Line 14'},
        {'id': 'a15', 'name': 'A15', 'desc': 'Address Line 15'},
        {'id': 'a16', 'name': 'A16', 'desc': 'Address Line 16'},
        {'id': 'a17', 'name': 'A17', 'desc': 'Address Line 17'},
        {'id': 'a18', 'name': 'A18', 'desc': 'Address Line 18'},
        {'id': 'a19', 'name': 'A19', 'desc': 'Address Line 19'},
        {'id': 's0',  'name': 'S0',  'desc': 'Status Line 0'},
        {'id': 's1',  'name': 'S1',  'desc': 'Status Line 1'},
        {'id': 's2',  'name': 'S2',  'desc': 'Status Line 2'},
        {'id': 'qs0', 'name': 'QS0', 'desc': 'Queue Status Line 0'},
        {'id': 'qs1', 'name': 'QS1', 'desc': 'Queue Status Line 1'},
{'id': 'clk', 'name': 'CLK', 'desc': 'CPU Clock'}, {'id': 'rdy', 'name': 'RDY', 'desc': 'CPU READY input'},
)
Channels is a tuple of channel descriptors, each with an id, name and description. We specify our 20 address and data lines, as well as the S0-S2 status lines, QS0-QS1 queue status lines, and of course, our CPU clock. We also add the READY line, as this is required for successfully calculating the CPU's T-states.
We'll need to be able to remember the numerical index of our inputs, so we also define a simple enumeration class so we can refer to pin indices by name:
class Pin:
    (
        AD0,
        AD1,
        AD2,
        AD3,
        AD4,
        AD5,
        AD6,
        AD7,
        A8,
        A9,
        A10,
        A11,
        A12,
        A13,
        A14,
        A15,
        A16,
        A17,
        A18,
        A19,
        S0,
        S1,
        S2,
        QS0,
        QS1,
        CLK,
RDY
) = range(26)
This should be enough to decode the instruction stream, but our IBM 5150 sniffer does have a few other signals as well - we captured INTR, DREQ and the 8253's CLK0. Our decoder can use them - but we may not want to require that everyone have captured such signals. A better option might be to make the extra logic specific to the IBM 5150 into a separate decoder. We'll touch on that later.
Calling wait() with no parameters will return when any change is detected on any pin. We could keep track of the CLK pin state and take action when CLK transitions from 0 to 1, but thankfully there's a shortcut. We can wait() on a specific pin, and moreover, either a rising or falling edge of said pin.
All of our logic will be triggered by the rising edge of CLK.
Here's the start of our decode method:
    def decode(self):
        while True:
            # Wait for rising edge on the CPU clock.
            pins = self.wait({Pin.CLK: 'r'})
The 'r' parameter indicates we want to wait for the rising edge of the specified pin. wait() then returns all the pin states at the instant our condition is met.
Annotations
Before we can emit annotations, we have to define the annotation types and annotation rows we will be using.
A single annotation row has a name and acts much like a signal row. An annotation row can contain different annotation types that you specify - the annotation types will be colored in different colors, allowing you to easily differentiate different events. It's up to you how to decide to group annotation types across rows. For our purposes, it makes sense to have a single Queue Status annotation row that can contain three annotation types: First Byte, Subsequent Byte, and Empty queue events.
We define annotations and annotation rows like so:
    annotations = (
        ('address-latch', 'Address Latch'),
        ('bus-status', 'Bus Status'),
        ('bus-status-latch', 'Bus Status Latch'),
        ('qs-f', 'Queue Status: F'),
        ('qs-e', 'Queue Status: S'),
        ('qs-s', 'Queue Status: E'),
        ('dbg-f', 'Debug Flag')
    )
    annotation_rows = (
        ('AL', 'Address Latch', (Annot.AddrLatch,)),
        ('BUS', 'Bus Status', (Annot.BusStatus,)),
        ('BUSL', 'Bus Status Latch', (Annot.BusStatusL,)),
        ('QOP', 'Queue Status', (Annot.QsF,Annot.QsS,Annot.QsE)),
        ('DBG', 'Debug', (Annot.Dbg))
    )
An annotation consists of a short name and a description. An annotation row includes a short name, description, and a list of annotation indices. We defined another enum class named 'Annot' to keep these sorted.
Notice the debug annotation row. This is temporary, but will come in handy if we want to emit some debug message during decoding.
Adding Logic
Here's our rough pseudocode for decoding the 8088, evaluated every time we wait on the CPU CLK:
- Decode the S0-S2 status lines into a bus status of 0-7.
- If the previous bus status was 7 (passive) and is no longer 7, this signifies the beginning of a bus m-cycle:
- Set the ALE flag to True.
- Save the bus status as bus_status_latch.
- If the bus status has changed, regardless of previous status:
- Emit an annotation for Bus Status, beginning at bus_status_start and ending at the current sample #.
- Update the value of bus_status_start to the current sample #.
- If the bus status is HALT, emit an annotation for HALT.
- Advance the CPU's T-cycle state.
- If ALE flag is True, and t_state != T1, set t_state to T1.
- Otherwise, advance t_state as follows:
- If t_state is T1:
- Clear ALE flag.
- Emit an annotation for ALE.
- Update t_state to T2.
- If t_state is T2:
- Update t_state to T3.
- Sample the RDY pin. If RDY is 1:
- Set data_valid to True.
- If t_state is T3:
- If RDY is high, update t_state to T4.
- If RDY is low, update t_state to Tw.
- If t_state is Tw:
- Sample the last RDY state:
- If the last RDY was 0,
- If current RDY is 1 set data_valid to True
- If the last RDY was 1,
- Update t_state to T4.
- Handle the data bus:
- If data_valid is True:
- Emit an annotation for D.
- Examine the value of bus_status_latch:
- If bus_status_latch is:
- CODE: Emit an annotation for FETCH
- Insert the value of D into the virtual processor queue.
- MEMR: Emit an annotation for MR
- Optionally detect memory address range and emit a DEV annotation.
- MEMW: Emit an annotation for MW
- Optionally detect memory address range and emit a DEV annotation.
- IOR: Emit an annotation for IOR
- Optionally decode port description based on address latch and emit a DEV annotation.
- IOW: Emit an annotation for IOW
- Optionally decode port description based on address latch and emit a DEV annotation.
- INTA: Emit an annotation for INT
- Optionally decode INT # and include description of interrupt type.
- Set data_valid to False.
- Decode the QS0-QS1 status lines into queue status of 0-3.
- If queue status is idle, do nothing.
- If queue status is First instruction byte:
- If inst_state is InInstruction:
- Disassemble the instruction byte stack and emit an annotation for INST using instruction_start as the starting sample.
- Clear the instruction byte stack.
- Pop a byte from the instruction queue.
- If the byte is an instruction prefix:
- If inst_state is InInstruction, set instruction_start to the current sample number.
- Set inst_state to WaitingForInstruction
- If the byte is an opcode:
- If inst_state is WaitingForInstruction, set inst_state to InInstruction.
- else, set inst_state to InInstruction and set instruction_start to the current sample number.
- Push the byte into the instruction byte stack.
- If the queue status is Subsequent instruction byte:
- Push the byte into the instruction byte stack.
- If the queue status is Empty queue:
- Clear the processor instruction queue.
- If the queue status is not idle:
- Emit an annotation for QOP
Don't worry if not all of that makes sense at the moment, it's a lot to chew on. Let's tackle it a piece at a time. The first thing to do is to decode our bus status lines.
To keep our decode() function from becoming too ponderous, we can split our decoding stages into different methods, and maintain various state variables on self - we can initialize those in start().
When dealing with changing state variables, we're very often keeping the previous value of a state to compare with the current state. This leads to a lot of duplicated variables like cur_status and prev_status, etc.
Let's make a simple class to simplify tracking of the previous state of a value:
class TrackedValue:
    def __init__(self, initial_value=None):
        self.prev = None
        self.cur = initial_value

    def update(self, new_value):
        self.prev = self.cur
        self.cur = new_value
        return self

    def changed(self):
        return self.prev != self.cur
Now we can maintain a value that keeps its previous value, and an update method that allows checking if the value changed.
We'll also keep track of the pin states for the previous cycle with a save_pins method, which still store them in a last_pins member at the end of every decode loop.
Decoding Bus Status
Now we can make our decode_status method like so:
    def decode_status(self, pins):

        # Decode bus status pins S0-S2 to BUS status.
        if (
            self.last_pins[Status.S0] != pins[Status.S0]
            or self.last_pins[Status.S1] != pins[Status.S1]
            or self.last_pins[Status.S2] != pins[Status.S2]
        ):
            # Any one of the three status lines has changed...

            # Emit annotation for the previous bus state.
            if self.bus_status_ss.cur is not None and self.bus_status.prev is not None:
                self.put(
                    self.bus_status_ss.cur,
                    self.samplenum,
                    self.out_ann,
                    [Annot.BusStatus, [BUS_STATES[self.bus_status.prev]]],
                )

            # Decode the bus status pins to an integer.
            self.bus_status.update(reduce_bus(pins[Status.S0 : Status.S2 + 1]))
            self.bus_status_ss.update(self.samplenum)

            if self.bus_status.prev is not None:
                if self.bus_status.prev == 7 and self.bus_status.cur != 7:
                    # New bus cycle is beginning, indicating the ALE signal should go high.
                    self.ale = True
                    # Latch the bus status. The instantaneous bus status goes LOW on T3, but
                    # we want to remember it to detect type of reads and writes.
                    self.bus_status_latch.update(self.bus_status.cur)
The
reduce_bus() function is a helper that will convert a range of pins into an integer value. It takes an exclusive range definition, so we add one to the end index.
Now we can load PulseView, and add our i8088 decoder from the list of available decoders, and we should see something like this:
We now have annotations for our bus status mnemonics, that extend for the entire period in which the bus status lines are unchanged. Internally, we are also keeping a bus_status_latch variable that will maintain its value for the entire bus cycle instead of reverting to the passive state on T3. This will help us properly annotate memory and IO operations later.
Calculating T-States
Next up is calculating T-States. Each CPU cycle will generally tick us to the next T-state, unless we are in Ti or Tw, which may repeat. We need to implement a little state machine.
It would be nice if we could use a Python
match statement, but currently sigrok-cli is bundled with Python 3.4, so we'll have to make do without.
For a first pass, let's just calculate the logic for T1 and ALE, and simply go to the next T state for every other state:
    def advance_t_state(self):
        # Check if we should transition to T1.
        if self.ale == True and self.t_state != TState.T1:
            self.t_state = TState.T1
        else:
            if self.t_state == TState.T1:
                # Clear the ALE state - it should only be active for one cycle.
                self.ale = False
                # Emit an ALE annotation.
                self.cycle_annot(Annot.ALE, "ALE")
                self.t_state = TState.T2
            elif self.t_state == TState.T2:
                self.t_state = TState.T3
            elif self.t_state == TState.T3:
                self.t_state = TState.T4
            elif self.t_state == TState.TW:
                self.t_state = TState.T4
            elif self.t_state == TState.T4:
                self.t_state = TState.TI
cycle_annot() is just a helper method that will produce an annotation that is one CPU cycle in width. That occurs often enough that it is useful to split out the logic.
Now we have an ALE signal for one cycle at the start of a new bus state.
Since we now have an ALE signal, now we can properly set the address latch. We'll call a function right after our advance_t_state() function to do this.
    def set_address_latch(self, pins):
        if self.ale:
            if self.al_ss.prev is not None:
                # Decode entire address bus and save sample
                self.al_annotation.update('%05X' % reduce_bus(pins[Addr.AD0:Addr.A19+1]))

                self.put(
                    self.al_ss.prev,
                    self.samplenum,
                    self.out_ann,
                    [Annot.AddrLatch, [self.al_annotation.prev]]
                )
This produces our Address Latch annotation:
Back to our T-Cycle calculations. Let's add the necessary logic to handle wait states, and set the data_valid flag, which indicates we can decode the data bus:
    def advance_t_state(self, pins):
        # Check if we should transition to T1.
        if self.ale == True and self.t_state != TState.T1:
            self.t_state = TState.T1
        else:
            if self.t_state == TState.T1:
                # Clear the ALE state - it should only be active for one cycle.
                self.ale = False
                self.cycle_annot(Annot.ALE, "ALE")
                self.t_state = TState.T2
            elif self.t_state == TState.T2:
                self.t_state = TState.T3
                if pins[Pin.RDY] == 1:
                    self.data_valid = True
            elif self.t_state == TState.T3:
                if pins[Pin.RDY] == 1:
                    self.t_state = TState.T4
                else:
                    self.t_state = TState.TW
            elif self.t_state == TState.TW:
                if self.last_pins[Pin.RDY] == 0:
                    if pins[Pin.RDY] == 1:
                        self.data_valid = True
                else:
                    self.t_state = TState.T4
            elif self.t_state == TState.T4:
                self.t_state = TState.TI
Our decode function now looks like this:
    def decode(self):
        while True:
            # Wait for rising edge on the CPU clock.
            pins = self.wait({Pin.CLK: 'r'})

            self.cycle_sample.update(self.samplenum)
            self.decode_status(pins)
            self.cycle_annot(T_ANNOTS[self.t_state], T_STATES[self.t_state])

            if self.data_valid:
                self.decode_data(pins)
                if self.bus_status_latch.cur == BusStatus.CODE:
                    # This was a code fetch. Process it.
                    self.fetch()

                self.data_valid = False

            self.advance_t_state(pins)
            self.set_address_latch(pins)
            self.save_pins(pins)
I set the current T-state annotation and read the data bus before advancing the T-state. I've also added new annotation rows for the data bus, and code fetches, which we easily detect since any valid data bus when the bus status is CODE must be a code fetch.
When we implement our queue, we can handle pushing fetched bytes into the queue in fetch(), as well.
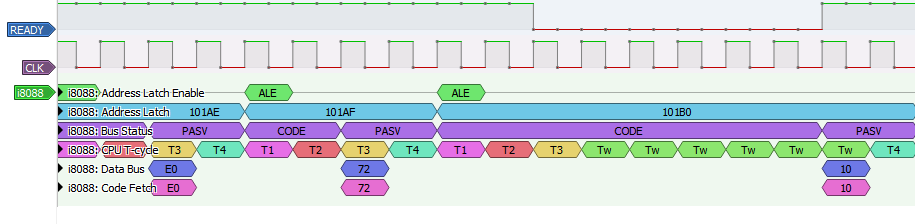
We can scroll around and verify that we seem to be handling wait states appropriately (see the wait states follow the READY line dropping low in the example above). We can also verify that our data bus is sampled either on T3, or in the presence of wait states, the last Tw cycle. Code fetch should mirror the data bus value when the bus status is CODE.
Decoding Queue Operations
To track the processor instruction queue, we need to know when to put bytes in, and when to take bytes out. We put bytes into the queue when a code fetch occurs - so we have that half sorted. To know when to take bytes out, we need to decode the queue status lines.
First, let's just check that we can decode the queue status lines correctly. Doing so is rather straightforward:
    def decode_queue(self, pins):
        if self.queue_status.update(reduce_bus(pins[Pin.QS0:Pin.QS1+1])).changed():
            if self.queue_status.prev != 0:
                self.cycle_annot(
                    QUEUE_ANNOTS[self.queue_status.prev],
                    QUEUE_STATES[self.queue_status.prev]
                )
We use different annotations per queue status, so that they will show up in different colors like our T-states do.
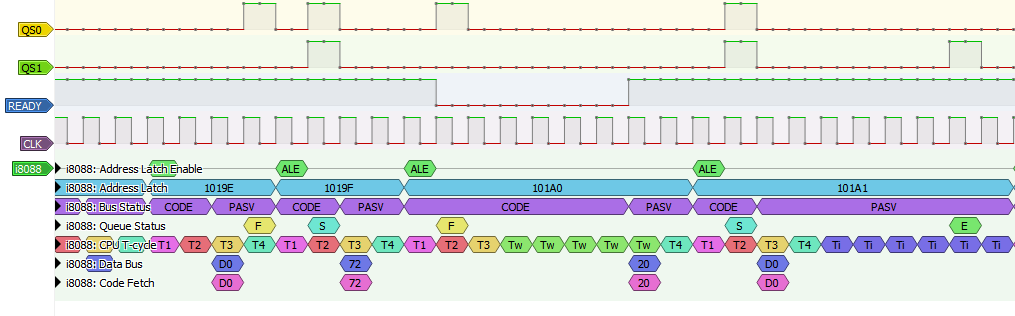
We're getting to the point where we can start to detect certain instructions - the repeated Ti states to the right are indicative of prefetch suspension, and the 'E' is a queue flush - this is clearly a control-flow related instruction of some sort, a JMP or CALL.
All we need to do now is track the queue - we will add a deque collection to our Decoder class. As bytes come in during code fetches, we will push them into the queue, and as bytes come out during an active queue status, we will pop them out. It's possible that our queue overflows or underflows due to the incomplete starting state of the capture, but things should sync back up quickly as soon as there's a flow control instruction.
Of course when there's a queue status of 'E', we will empty the queue.
When we pop a byte from the queue under a queue status of 'F', we can add that byte to a separate instruction list. This list will build up the byte representation of the instruction being executed. When we hit the next queue status of 'F' we know the current instruction has ended. At that point we can do something with our instruction bytes, and then clear the instruction list.
Let's add annotation rows for the instruction queue and instruction byte list so we can track what's going on. We'll emit an instruction queue annotation every time the queue is updated - either via a push or pop.
I've added debug annotations that print the value of the byte being read from the queue just to check my logic. We can see in the first subsequent byte read 'S' we read '18' from the queue, and correspondingly the '18' from the previous queue annotation disappears (and our queue is now empty or '-'). The 18 is also added to the instruction byte list.
Disassembling the Instruction
A full disassembler is possible, although a disassembler for even the first iteration of x86 is non-trivial. Instead, we'll focus on getting the opcode mnemonic.
Disassembly is perhaps best handled in a separate file, so we'll create a new file alongside our decoder called 'disasm.py'. We'll create a Disassembler class, and the first order of business is to simply list out all the 8088 mnemonics:
class Disassembler:
    def __init__(self):
        self.mnemonics = [
            "ADD",
            "PUSH",
            "POP",
            "OR",
            "ADC",
...
We'll also create an array of 256 elements, for each possible opcode that maps back to the list of mnemonics:
        self.opcode_refs = [
            0, 0, 0, 0, 0, 0, 1, 2, 3, 3, 3, 3, 3, 3, 1, 2,
            4, 4, 4, 4, 4, 4, 1, 2, 5, 5, 5, 5, 5, 5, 1, 2,
            6, 6, 6, 6, 6, 6, 7, 8, 9, 9, 9, 9, 9, 9, 10, 11,
...
Now we can create a simple disassembly function and helper:
    def lookup_opcode(self, byte):
        if not (isinstance(byte, int) and 0 <= byte <= 255):
            raise ValueError("Expected a byte (0-255), got: {}".format(byte))
return self.mnemonics[self.opcode_refs[byte]]
    def disassemble(self, code_bytes):
        if len(code_bytes) == 0:
            return "bad"

        return self.lookup_opcode(code_bytes[0])
disassemble() will take our instruction byte list, so if we ever wanted to produce a full disassembler, we will have access to the full instruction.
Back in decode_queue() in our decoder, we can disassemble the current instruction byte list when we reach the next 'First Byte' fetch:
                if self.queue_status.cur == QueueOp.First:
                    # Update disassembly and clear instruction deque
                    self.instr_ss.update(self.samplenum)
                    self.opcode.update(self.instr[0])
                    try:
                        self.mnemonic.update(self.disasm.disassemble(list(self.instr)))
                    except:
                        self.mnemonic.update("inval")
                        self.error_annot("e:{}".format(e))
Now we should have an instruction disassembly annotation like so:
Seeing the 'E' queue status in a 'JB' instruction checks out - looks like we took that jump. But what's up with the 'GRP4' instruction?
Unfortunately on the 8088, there's not a clean 1:1 mapping between opcode byte and instruction due to the presence of
group opcodes - certain instructions share the same base opcode byte. A single lookup table won't suffice. To determine the actual instruction mnemonic we have to examine the opcode extension field of the instruction's
modrm byte.
To address this, we'll convert our list of mnemonic strings into a list of tuples, storing a group index offset by one:
...
  ("WAIT", 0),
  ("INVAL", 0),
  ("GRP1", 1),
  ("GRP2A", 2),
  ("GRP3", 3),
  ("GRP4", 4),
  ("GRP5", 5),
  ("GRP2B", 6),
  ("NOP", 0),
When we look up our mnemonic, we'll check this value. If it is 0, we have a direct mapping to opcode. If it is >0, we'll subtract 1 from the value and use it as the outer index into a list of lists containing the mnemonics for all group opcodes:
        self.grp_mnemonics = [
            [
                "ADD",
                "OR",
                "ADC",
                "SBB",
                "AND",
                "SUB",
                "XOR",
                "CMP"
            ],[
                "ROL",
                "ROR",
                "RCL",
                "RCR",
...
The inner index will come from the opcode extension field of the modrm byte.
Our disassembly functions now look like this:
    def lookup_opcode(self, byte, modrm=None):
        if not (isinstance(byte, int) and 0 <= byte <= 255):
            raise ValueError("Expected a byte (0-255), got: {}".format(byte))

        op_tuple = self.mnemonics[self.opcode_refs[byte]]

        if op_tuple[1] > 0:
            # Group opcode.
            if modrm is None:
                raise ValueError("Group opcode with no modrm")

            op_ext = (modrm >> 3) & 0x07
            return self.grp_mnemonics[op_tuple[1]-1][op_ext]
        else:
            return op_tuple[0]

    def disassemble(self, code_bytes):
        if len(code_bytes) == 0:
            return "nul"
        elif len(code_bytes) == 1:
            return self.lookup_opcode(code_bytes[0])
        else:
            return self.lookup_opcode(code_bytes[0], code_bytes[1])
We can now verify that group opcodes such as these D0 & D1 shift instructions are properly decoded:
There's a few more details we can add to our decoder, such as decoding the active segment from S3 and S4, and the status of the Interrupt flag from S5. Pulling out the interrupt vector on the second INTA cycle might be useful, too. We could get even more ambitious and try to track the value of CS by monitoring stack activity during flow control instructions. If we knew CS, we could calculate IP as well during code fetches.
For the moment though, we've accomplished our goal of seeing the instruction stream.
Zooming in and out in the logic analyzer is a lot faster and more fluid than trying to do it the same in Excel. It becomes quite apparent what the interesting 'gaps' in the capture are even when zoomed out:
They're long running string instructions. We haven't decoded the 'REP' prefix in our simple disassembler, but it's a safe assumption that there is one here.
Other gaps turn out to have a different, but equally reasonable explanation:
More Decoders
We may have completed the decoder for the CPU, but our IBM 5150 bus sniffer pulled in a few miscellaneous signals of the motherboard. These aren't necessarily unique to the 8088, and we may not want every user of our 8088 decoder to have to supply them. While we could make them optional inputs to our 8088 decoder, it may make more sense to make a separate "ibm5150" decoder. This decoder can be 'stacked' - that is, take the output of the 8088 decoder as an input. When we wait() in a stacked decoder, we can wait on annotation changes just like we would pin changes.
We can then access our decoded status lines, along with DREQ, and decode all the miscellaneous DMA states (which we covered in a
previous blog). We could also take our port addresses for IO transfers and resolve them to short device descriptions.
Handling our VSYNC and HSYNC signals, likewise, are probably best done in a separate 'cga' decoder if we want to calculate the raster position on screen - we'll probably want to take a clock divisor input along with the clock line to use. That way, inputting the IBM 5150's CPU divisor of 3 will produce the correct raster positions if we use the CPU clock as our clock input.
Wrapping Up
If you're read this far, thank you for following along. We have a lot of tools in our disassembly toolbox at this point. The next step is modifying MartyPC's logging facilities to export cycle logs in CSV in a compatible format so they can be imported into PulseView. Viewing emulator output in a logic analyzer? Why not!
I have plan for using PulseView as an advanced diff tool. If I combine the CSV logs from the logic analyzer with the logs from MartyPC, but prefix all of MartyPC's columns with 'm', then I can add a second 8088 decoder and see the hardware traces and emulator traces within PulseView simultaneously. Deviations from hardware then should be rather clear, and we'll be able to easily visualize the rate at which errors in our timings accrue. The only tricky bit is lining up the samples. If we have a common point of reference, such as our keyboard interrupt trigger, that shouldn't be too difficult.
But that's a topic for a future blog.
Since we can create comments at any point in our analyzer file, I would eventually like to produce different annotated captures of potential interest to the PC emulation community. Imagine a full cycle trace of the IBM 5150 boot process with comments at different points in the POST process. Or a full listing of the Area 5150 Lake effect setup and first few frames, with comments illustrating the start of each interrupt in the vsync interrupt setup chain.
The possibilities are endless - and I hope to start using these tools to tackle some of my open Github issues. Some of those might even make decent future blog postings!
Resources
You can find the source for the 8088 decoder
here. To use it, simply copy the Python files into an 'i8088' directory in the plugins directory of your PulseView installation or the path specified by the
SIGROKDECODE_DIR environment variable. Drag the decoder out from the decoder list into the analyzer view, and set the inputs if they weren't automatically detected.


Comments
Post a Comment